Calculation of Gibbs Energy Curves
Purpose: Learn to calculate the Gibbs energy of a system or individual phase
Module: PanPhaseDiagram
Thermodynamic Database: AlMgZn.tdb
Batch file: Example_#1.9.pbfx
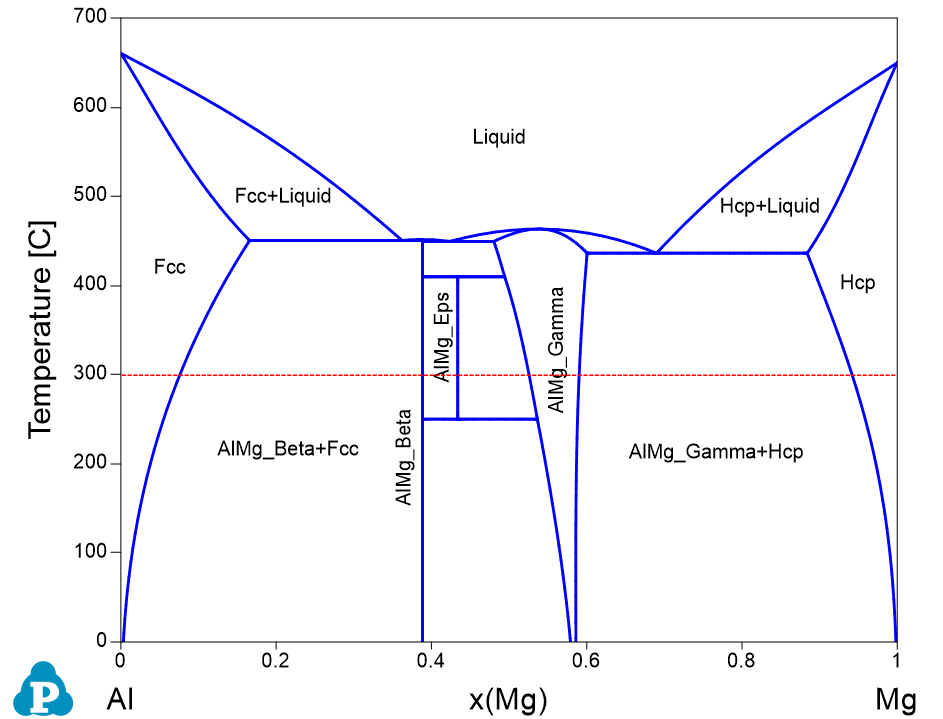
Figure 1 is the Al-Mg binary phase diagram. In this example, we learn to calculate the Gibbs energy of the system and the Gibbs energy of each phase as a function of composition, x(Mg), at 300°C (the red dash line).
Calculation Method 1, From menu bar “Property”:
-
Load AlMgZn.tdb following the procedure in Pandat User's Guide: Load Database , and select Al and Mg two components;
-
Click “Property” on the menu bar and select “Thermodynamic Property”;
-
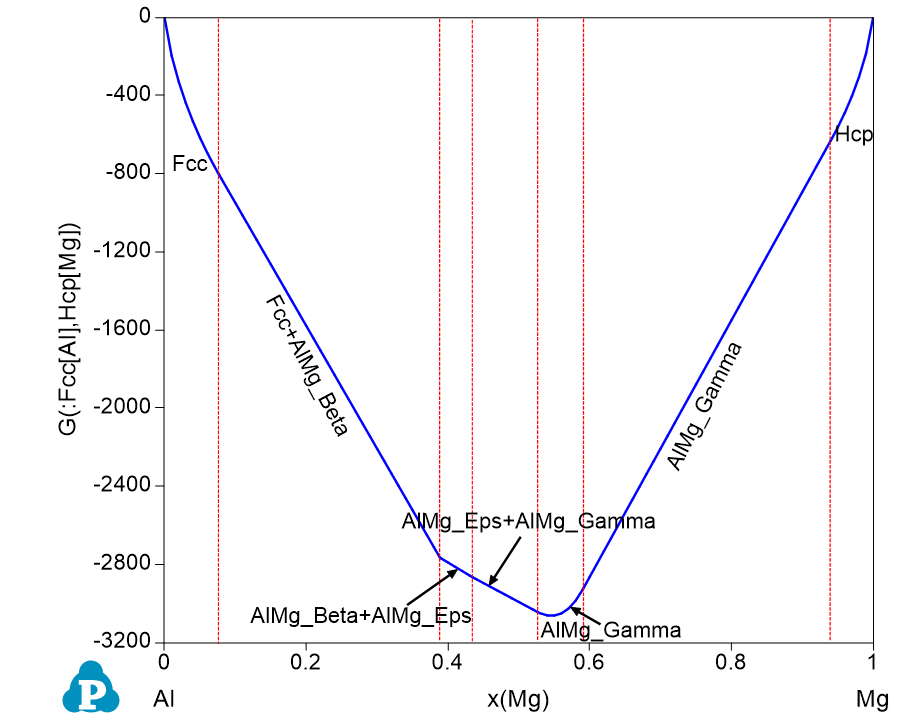
Set Calculation Condition as shown in Figure 2. The property selected is G, and the reference states are set as Fcc for Al and Hcp for Mg, the Gibbs energy of the system (stable phases in each composition range) will be calculated as shown by Figure 4;
-
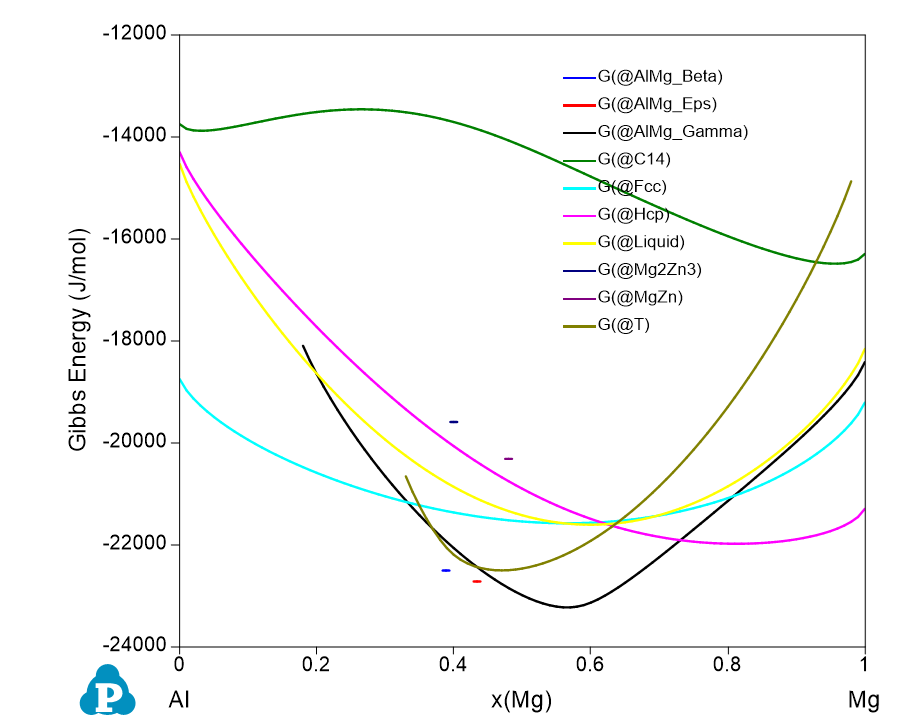
If the “Individual Phases” is checked, and G(@*) is selected instead of G, the Gibbs energy curve of every phase as a function of composition will be calculated as shown by Figure 5;
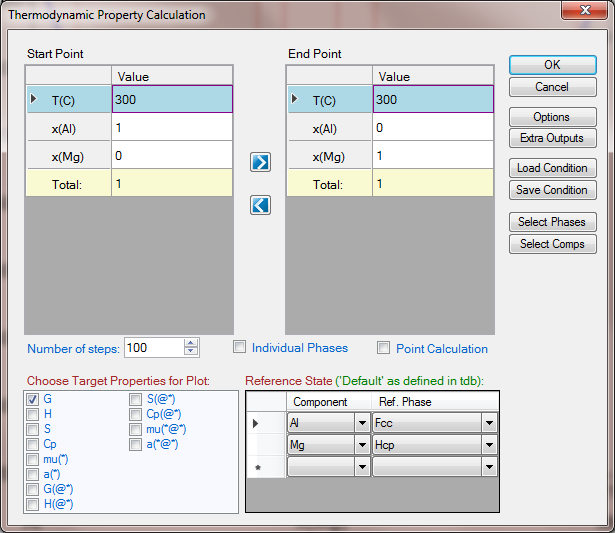
Figure 2: Calculation of the Gibbs energy for individual phases or the system from “Property” calculation
Calculation Method 2, from Line calculation function in PanPhaseDiagram module:
-
Load AlMgZn.tdb following the procedure in Pandat User's Guide: Load Database, and select Al and Mg two components;
-
Click “PanPhaseDiagram” on the menu bar and select “Line Calculation”;
-
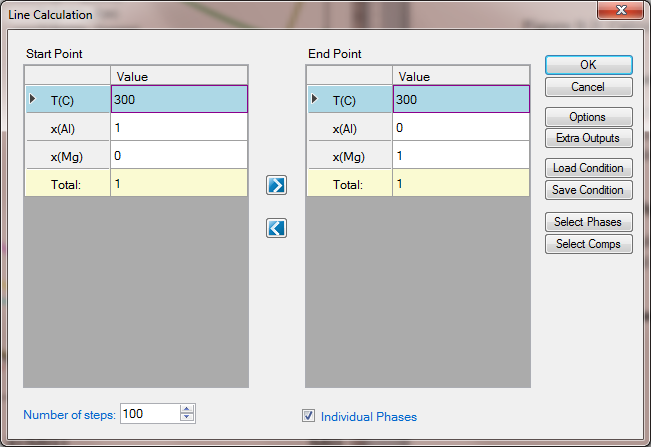
Set Calculation Condition as shown in Figure 3, check the “Individual Phases”;
Post Calculation Operation:
-
Change graph appearance following the procedure in Pandat User's Guide: Property;
-
Add text and arrow on the plot following the procedure in Pandat User's Guide: Icons for Graph on Toolbar;
Information obtained from this calculation:
-
Figure 4 shows the Gibbs energy of the system as a function of x(Mg), i.e., the Gibbs energy at each composition represents the Gibbs energy of the stable phase(s) at that composition;
-
Figure 5 shows the Gibbs energy curve of every individual phase as a function of x(Mg)
-
Detail Gibbs energy values can be found in the “thermodynamic property” table